NEWS
LATEST ARTICLES
 https://www.youngsolutions.net/wp-content/uploads/2020/08/iStock-1135087076-scaled.jpg
1707
2560
Ben Young
https://youngsolutions.net/wp-content/uploads/2019/08/logo-1.png
Ben Young2019-10-15 18:36:542022-04-11 17:18:10Measurement Systems Analysis
https://www.youngsolutions.net/wp-content/uploads/2020/08/iStock-1135087076-scaled.jpg
1707
2560
Ben Young
https://youngsolutions.net/wp-content/uploads/2019/08/logo-1.png
Ben Young2019-10-15 18:36:542022-04-11 17:18:10Measurement Systems Analysis https://www.youngsolutions.net/wp-content/uploads/2019/10/inspection-validation.jpg
275
400
Ben Young
https://youngsolutions.net/wp-content/uploads/2019/08/logo-1.png
Ben Young2019-10-15 18:35:342024-11-27 16:44:10Inspection Validation
https://www.youngsolutions.net/wp-content/uploads/2019/10/inspection-validation.jpg
275
400
Ben Young
https://youngsolutions.net/wp-content/uploads/2019/08/logo-1.png
Ben Young2019-10-15 18:35:342024-11-27 16:44:10Inspection Validation https://www.youngsolutions.net/wp-content/uploads/2019/10/process-flow-1.jpg
225
300
Ben Young
https://youngsolutions.net/wp-content/uploads/2019/08/logo-1.png
Ben Young2019-10-15 18:28:192022-04-11 17:39:27Process Flow Diagram
https://www.youngsolutions.net/wp-content/uploads/2019/10/process-flow-1.jpg
225
300
Ben Young
https://youngsolutions.net/wp-content/uploads/2019/08/logo-1.png
Ben Young2019-10-15 18:28:192022-04-11 17:39:27Process Flow Diagram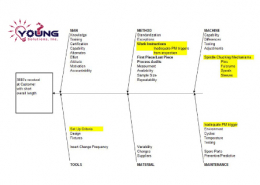 https://www.youngsolutions.net/wp-content/uploads/2019/10/fishbone-diagram-1.jpg
330
450
Ben Young
https://youngsolutions.net/wp-content/uploads/2019/08/logo-1.png
Ben Young2019-10-15 18:25:462022-04-11 17:19:33Fishbone Diagrams
https://www.youngsolutions.net/wp-content/uploads/2019/10/fishbone-diagram-1.jpg
330
450
Ben Young
https://youngsolutions.net/wp-content/uploads/2019/08/logo-1.png
Ben Young2019-10-15 18:25:462022-04-11 17:19:33Fishbone Diagrams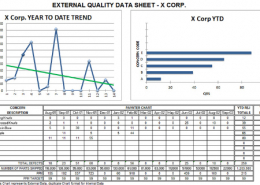 https://www.youngsolutions.net/wp-content/uploads/2019/10/paynter-chart-1.jpg
330
450
Ben Young
https://youngsolutions.net/wp-content/uploads/2019/08/logo-1.png
Ben Young2019-10-15 18:24:252022-04-11 17:20:00Paynter Charts
https://www.youngsolutions.net/wp-content/uploads/2019/10/paynter-chart-1.jpg
330
450
Ben Young
https://youngsolutions.net/wp-content/uploads/2019/08/logo-1.png
Ben Young2019-10-15 18:24:252022-04-11 17:20:00Paynter Charts https://www.youngsolutions.net/wp-content/uploads/2019/10/root-cause-1.jpg
330
450
Ben Young
https://youngsolutions.net/wp-content/uploads/2019/08/logo-1.png
Ben Young2019-10-15 18:22:162022-04-11 17:20:24Corrective Actions & Root Cause
https://www.youngsolutions.net/wp-content/uploads/2019/10/root-cause-1.jpg
330
450
Ben Young
https://youngsolutions.net/wp-content/uploads/2019/08/logo-1.png
Ben Young2019-10-15 18:22:162022-04-11 17:20:24Corrective Actions & Root Cause